I’ll be returning to the preseason previews later this week.
Thanks to help from kind people at hsquizbowl.org, I’ve recently collected some data on the ZIP code that high schools are located in and the median household income for that ZIP. I then compared each schools’ aPPB rank (with 1st being the best team, LASA A of Texas) with their median household income for their ZIP code (with 1st being the ZIP with the highest such income, which is 94207, home to both Menlo High School and Menlo-Atherton High School of California).
For the purpose of this exercise, I excluded international schools (sorry, Canada, Singapore and China!). I also ignored teams beyond the A team for each school (so LASA B, LASA C, etc. were ignored).
This comparison included 1,249 schools in the United States that had played at at least one high school quiz bowl tournament that used pyramidal tossups and 30 part bonuses.
The Pearson’s r value that I calculated for this data was 0.3482. According to this resource for interpreting Pearson’s r, values between +0.30 and +0.39 indicates a “moderate positive relationship.” A positive relationship means that as one value increases, the other value increases as well. If the Pearson’s r value was 1, this would mean that there was a perfect relationship between aPPB and median per capita income – the richest ZIP code would have the best team by aPPB, and so forth.
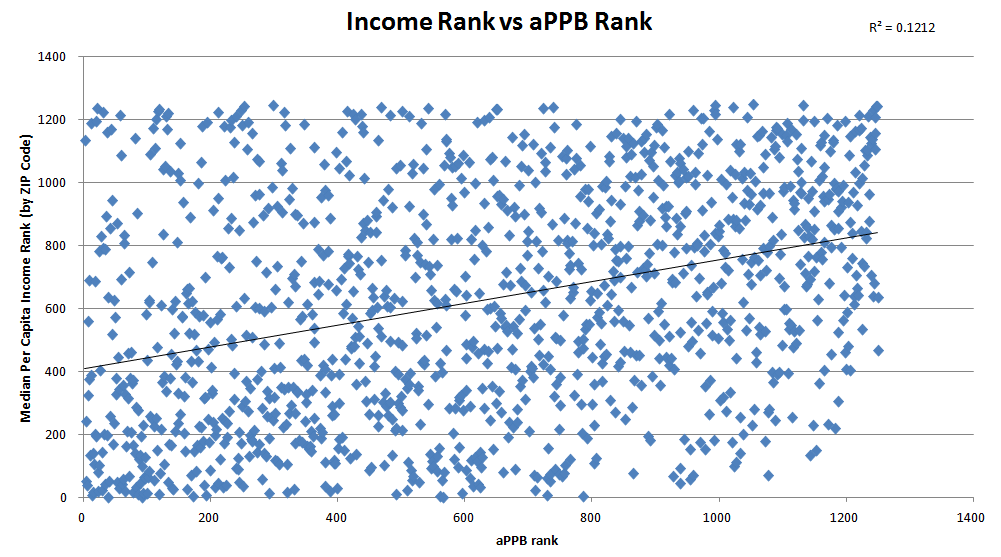
Note that the x-axis is the team’s aPPB rank (again, with 1 being the best team by that measure) and the y-axis is the ZIP code’s median income (again, with 1 being the highest median household income).
What does this mean?
Well, nothing definitively. First of all, correlation does not mean causation. There could be no actual relationship between median per capita household income and my statistic for ranking quiz bowl teams. Let me first go ahead and point out why this could mean nothing.
1) Statistics that measure the success of schools – standardized test scores, for example – rely upon a large number, if not all, the students in a particular school. Quiz bowl ability can literally be due to one student. Obviously, an individual can easily be an outlier in term of his/her household income as compared with the other residents of his/her ZIP code.
2) I realized after gathering my data that using information derived from the school’s ZIP code will likely not result in as high quality of a comparison as using information based off the school district as a whole. And of course, the question would then become how do you handle private schools?
3) People living in a different ZIP than their high school is not exactly impossible.
4) There’s a pretty big difference between “learning for a standardized test” and “learning for quiz bowl.” They’re clearly two different knowledge bases and skill sets.
Still, I feel like there is something to this. A higher income in a ZIP likely means more students coming from a family with a higher education level.
Things to do with this data
- Double check all ZIP codes. There were originally a handful of incorrect ZIP codes that didn’t exist, with two schools that had ZIP codes that didn’t have median income data. I corrected the former mistakes and handled the latter in one case by using the only other ZIP code for the town in question (Normal, Illinois) and in the other case of assigning the ZIP code of a nearby high school (Youngstown Early College was the one affected by this).
- Do this comparison using median income information by school district. This will likely allow for a more accurate comparison of these two data points
- Compare the income of schools that have a quiz bowl team with those that don’t. I would be absolutely shocked if it wasn’t true that as a school’s income decreased, the likelihood of having a quiz bowl team would decrease as well.
This is the Excel sheet of my data. I have also set up a discussion thread on HSQB. Feel free to talk about this there, or in the comments here.

What’s the correlation for the top 100 or so schools? That looks like that might be more positive than say data from a random affluent school that doesn’t care about quiz bowl